 www.geodatenkatalog.de (S3L)
Keyword
Human health and safety
130 record(s)
Provided by
Type of resources
Available actions
Topics
Keywords
Contact for the resource
Update frequencies
Service types
-
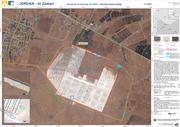
The Al Zaatari refugee camp in Jordan is situated approx. 12 km from the Syrian border and in close proximity to the city of Al Mafraq (10 km). Due to heavy rainfall in the region parts of the Zaatari camp are affected by flooding. The map shows the flood situation derived by semi-automatic image analysis of TerraSAR-X data acquired on January 10, 2013 at 03:38:49 UTC. Furthermore basic reference information, digitized on the basis of WorldView-2 satellite data acquired on January 03, 2013, at 08:52:52 UTC, is depicted. The contour lines were derived from ASTER GDEM 2 data (vertical accuracy +/- 6m). For a more detailed view on the flood situation, parts of the camp area are also shown in the zoom boxes. The results of the image interpretation and analysis have not been validated in the field. WorldView-2 satellite data acquired on January 03, 2013, is used as backdrop. Please note that flood waters in settlement areas might not be fully captured and the water extent might be underestimated due to sensor characteristics. Thus especially shallow water bodies might not be fully captured. The products elaborated for this Rapid Mapping Activity are realised to the best of our ability, within a very short time frame, optimising the material available. All geographic information has limitations due to the scale, resolution, date and interpretation of the original source materials. No liability concerning the content or the use thereof is assumed by the producer. The ZKI crisis maps are constantly updated. Please make sure to visit http://www.zki.dlr.de for the latest version of this product.
-
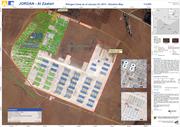
The map shows the Al Zaatari refugee camp in Jordan. It is situated approx. 12 km from the Syrian border and in close proximity to the city of Al Mafraq (10 km). The camp was set up on July 28, 2012, to shelter refugees fleeing the conflict in Syria. The map shows general characteristics of the camp infrastructure, including camp extent, location of shelters, containers and facility buildings, road infrastructure and the runway area. For a more detailed view parts of the camp area are also shown in the zoom boxes. The vector data have been digitized on the basis of WorldView-2 satellite data (0.5 m spatial resolution) acquired on January 03, 2013. The results have not been validated in the field. WorldView-2 satellite data acquired on January 03, 2013, is used as backdrop. The products elaborated for this Rapid Mapping Activity are realised to the best of our ability, within a very short time frame, optimising the material available. All geographic information has limitations due to the scale, resolution, date and interpretation of the original source materials. No liability concerning the content or the use thereof is assumed by the producer. The ZKI crisis maps are constantly updated.
-
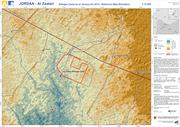
The map shows the elevation of the surroundings of the Al Zaatari refugee camp in Jordan. The elevation information is derived from ASTER GDEM 2 data (vertical accuracy +/- 6m). Furthermore basic reference information, digitized on the basis of WorldView-2 satellite data acquired on January 03, 2013, at 08:52:52 UTC and LANDSAT-7 data acquired on December 16, 2012 at 08:07:11 UTC, is depicted. Not all settlements are captured. The results have not been validated in the field. ASTER GDEM 2 data as well as a hillshade derived from this data is used as backdrop. Please note, that information on elevation derived from ASTER data does not apply for the refugee camp area. ASTER data was acquired before 2011 and the elevation might have changed due to construction works. The products elaborated for this Rapid Mapping Activity are realised to the best of our ability, within a very short time frame, optimising the material available. All geographic information has limitations due to the scale, resolution, date and interpretation of the original source materials. No liability concerning the content or the use thereof is assumed by the producer. The ZKI crisis maps are constantly updated. Please make sure to visit http://www.zki.dlr.de for the latest version of this product.
-
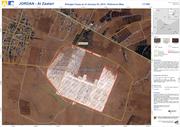
The map shows the Al Zaatari refugee camp in Jordan. It is situated approx. 12 km from the Syrian border and in close proximity to the city of Al Mafraq (10 km). The camp was set up on July 28, 2012 to shelter refugees fleeing the conflict in Syria. The vector data have been digitized on the basis of WorldView-2 satellite data (0.5m spatial resolution) acquired on January 03, 2013. The results have not been validated in the field. WorldView-2 satellite data acquired on January 03, 2013 is used as backdrop. The products elaborated for this Rapid Mapping Activity are realised to the best of our ability, within a very short time frame, optimising the material available. All geographic information has limitations due to the scale, resolution, date and interpretation of the original source materials. No liability concerning the content or the use thereof is assumed by the producer. The ZKI crisis maps are constantly updated. Please make sure to visit http://www.zki.dlr.de for the latest version of this product.
-
Die Themengruppe beinhaltet folgende Daten, jeweils für PM10 (Feinstaub) und NO2 (Stickstoffdioxd), als Jahresmittelwert für das Jahr 2015: * Durchschnittliche flächenhafte Belastung im km-Raster * Durchschnittliche Straßenrandbelastung an mindestens 100 m langen Straßenabschnitten an einem ausgewählten Hauptstraßennetz der Landeshauptstadt Dresden. Diese Daten wurden mithilfe folgender Eingangsdaten berechnet: * Verkehrsstärken (Zählungen des Straßen- und Tiefbauamtes der Stadt Dresden, aufbereitet durch das Umweltamt - Stand 2015), * Fahrmuster-Ermittlung durch den Lehrstuhl für Verkehrsökologie an der TU Dresden im Auftrag des LfULG unter Zuhilfenahme von FCD-Taxidaten aus VAMOS-System der Stadt Dresden 2013 * Emissionsfaktoren der Kraftfahrzeuge (HBEFA 3.2) mit Korrekturen durch das LfULG, * Emissionsdaten für Abrieb und Aufwirbelungen durch den Kraftfahrzeugverkehr (Abrieb von Bremsbelägen, Kupplungen, Reifen und Straßenoberflächen als zusätzlicher Staubquelle) die auf Arbeiten des Ingenieurbüros Lohmeyer GmbH & Co. KG beruhen und ähnlich den dem Handbuch für Emissionsfaktoren (HBEFA) bestimmten Verkehrssituationen zugeordnet wurden, * Neigung der Straßenabschnitte (Umweltamt) 2015 * Bebauungsdaten wie durchschnittliche Höhe, durchschnittlicher Abstand und durchschnittliche Dichte der Bebauung an dem jeweiligen Straßenabschnitt, die auf Grundlage der digitalen Stadtkarte ermittelt wurden (Umweltamt) * Meteorologische Ausbreitungsbedingungen (Windstatistik Großer Garten, DWD) * Messdaten der ständigen Luftschadstoffüberwachung des LfULG * Daten des sächsischen Emissionskatasters Die Berechnung erfolgt sowohl die flächenhafte Belastung wie auch die Straßenrandbelastung mit Hilfe des Programmsystems Immikart, das das Ingenieurbüro Lohmeyer GmbH & Co. KG für das Sächsische Landesamt für Umwelt, Landwirtschaft und Geologie entwickelt hat. Das Programmsystem beinhaltet sowohl ein Modul für die flächenhafte Belastung als ein Modul für die direkte Straßenrandbelastung in bebautem Gebiet (Prokas B). Als Maß für die Güte der Berechnungen dient dabei die erreichte Übereinstimmung mit gemessenen Werten. Die Daten der flächenhaften Belastung wurden zur Darstellung mit Hilfe eines GIS-Systems ¿über das Stadtgebiet gelegt¿. Die Daten zur Straßenrandbelastung wurden zur Darstellung auf das Straßenknotennetz Stadt Dresden (ESKN 25) mit Hilfe einer Schlüsselbrücke übertragen.
-
Klötzchenmodell (LOD1) für Lärmkartierung 2022 LOD1-Gebäudehöhen werden automatisch ermittelt, indem innerhalb der Grundrisse ein Mittelwert aus den Höhen der Laserscannerdaten berechnet wird. Bei Photogrammetrischer Messung wird der Mittelwert zwischen First und Traufhöhe verwendet. Ggf. werden Grundrisse geteilt, wenn dieser Mittelwert aufgrund von unterschiedlich hohen Gebäudeteilen zu stark von den Gebäudeteilen abweicht (> 2 m, > 20 qm) und anschließend neue Mittelwerte der Gebäudeteile berechnet. So wird auch im LOD1-Klötzenmodell eine genaue Abbildung der Dachlandschaft erreicht, je nach Dachform beträgt die absolute Höhengenauigkeit < 3 m.
-
Lärmschutzwände für Lärmkartierung 2017
-
Geräuschbelastung durch den Luftverkehr als Tag-Abend-Nacht-Lärmindex im Ballungsraum; Ergebnis der Lärmkartierung 2022 nach der EG-Umgebungslärmrichtlinie
-
Geräuschbelastung durch den Kfz-Verkehr als Tag-Abend-Nacht-Lärmindex; Ergebnis der Lärmkartierung 2022 nach der EG-Umgebungslärmrichtlinie
-
Geräuschbelastung durch den Kfz-Verkehr als Nacht-Lärmindex; Ergebnis der Lärmkartierung 2022 nach der EG-Umgebungslärmrichtlinie